FITTING A ONE-HIT MODEL TO DATA IN TABLE 5-2
Since 1-hit model gives LCR(0) = 0, fit to number of excess tumors:
|
A |
B |
C |
D |
E |
F |
G |
H |
|
# rats |
# with tum |
Excess tumors |
prop excess |
rat dose |
hum dose |
pi |
lnlike |
|
70 |
8 |
0 |
0 |
0 |
0 |
0 |
|
|
70 |
26 |
18 |
0.290 |
6.25 |
1.785 |
0.0517 |
-55.64 |
|
70 |
33 |
25 |
0.403 |
20 |
5.714 |
0.1563 |
-54.04 |
|
70 |
41 |
33 |
0.532 |
62.5 |
17.857 |
0.412 |
-48.90 |
|
70 |
48 |
40 |
0.645 |
200 |
57.142 |
0.817 |
-59.07 |
|
q= |
0.0297 |
log lik = |
-217.6 |
C = B - 8 D = C/62 F = E/3.5 G = 1 - Exp(-qF)
H = C*ln(G) + (62 - C)*ln(1-G)
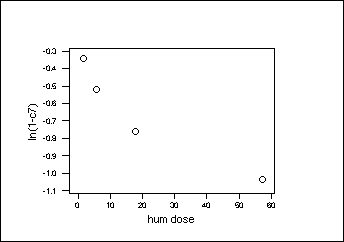
Seed 0.001 doesn't give solution. To find better seed, graph ln(1 -excess prop) vs dose and fit line without intercept: ln(1-c7) = - 0.0211 hum dose, so try seed 0.02.
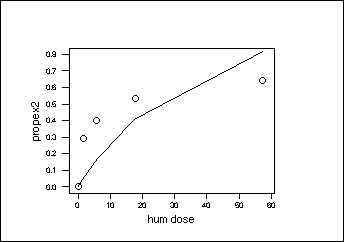
Note: Graph suggests one-hit fit won't be good:

|
hum dose |
1-hit |
exs prop |
|
0 |
0 |
0 |
|
1.785 |
0.0521 |
0.29 |
|
5.714 |
0.1575 |
0.403 |
|
17.857 |
0.4147 |
0.532 |
|
57.142 |
0.8199 |
0.645 |

