PROBLEM 4-4
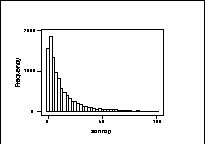
Residence Occupancy Period
Weibull, shape 0.8, scale 11
(to get mean 13.2, 95th percentile 41.4)
(sample mean = 12.382, 95th pctile 42.5515)
26 cases with ROP _ 100 were deleted, leaving 10074
(giving sample mean 12.099, 95th pctile 41.7868)
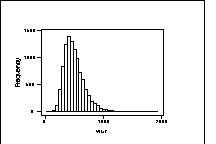
Water Use Rate: (10,074 samples)
Lognormal, mu = 6.14, sigma = 0.33 (for logX)
(To get mean 480, 95th percentile 800)
(sample has mean = 490.59, 95th pctile 798.86,
max 1912.25)
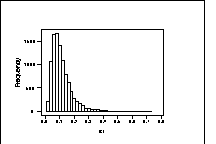
Exposure Time: 10074 samples,
Lognormal, mu = -2.347, sigma = 0.563 (for logX)
(to get mean 0.13, 95th percentile 0.28
Sample: Mean 0.11, Max 0.72.
What shape should we expect for total exposure?
Total exposure simulated as
365 X use rate X exposure time X occupancy period
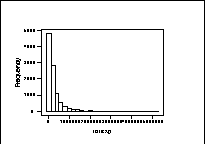
Mean 240,359 (compare with 300,000)
95th percentile: 900,555 (compare with 3,400,000)
Correlations
rop wur et
wur 0.001
et 0.005 0.011
totexp 0.735 0.213 0.376
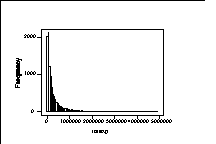
NEW GRAPH OF SIMULATED TOTAL EXPOSURE
100 BINS
Q1 33,555 MEDIAN 109,068
Q3 286,610 MAX 4,722,010
166 VALUES (1.65%) > 1,500,000
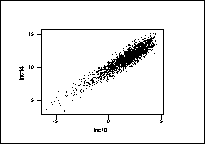
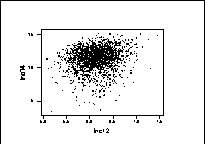
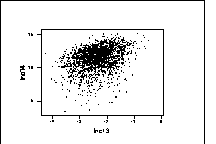
PLOTS OF 2000 SIMULATIONS
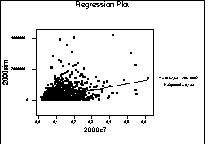
TOTAL EXPOSURE VS RESIDENCE OCCUPANCY PERIOD:
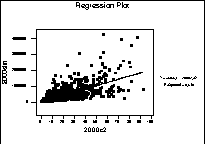
TOTAL EXPOSURE VS WATER USE RATE:
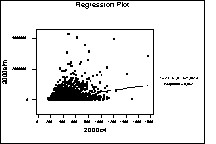
TOTAL EXPOSURE VS EXPOSURE TIME
SUMMARY STATISTICS FOR SIMULATION OUTPUT OF TOTAL EXPOSURE
N Mean Median StDev Min Max
10074 240,359 109,068 382,277 3 4,722,010
PERCENTILE LITERS OF WATER
5% 10,027
10% 12,630
25% 33,555
50% 109,068
75% 286,680
90% 1,511,650
95% 1,300,037
99% 1,453,599
PLOTS OF LOGS OF 2000 SIMULATIONS
LOG TOT EXP VS LOG ROP
LOG TOT EXP VS LOG WATER USE RATE:
LOG TOT EXP VS EXPOSURE TIME
CORRELATIONS OF LOGS
Ln ROP ln WUR lncET
lnROP -0.021
ln WUR -0.011 -0.023
ln ET 0.924 0.167 0.319