BEEF CONSUMPTION
EPA Exposure Factors Handbook:
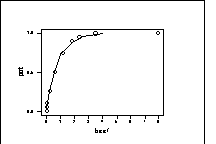
Based on 1989-91 data, total US beef consumption (g/kg/day) has the following empirical distribution:
Mean P1 P5 P10 P25 P50 P75 P90 P95 P99 P100
0.825 0 0 0.055 0.268 0.626 1.163 1.804 2.327 3.478 7.959
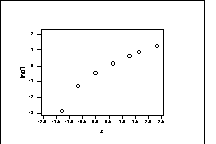
A lognormal plot doesn't look too good:

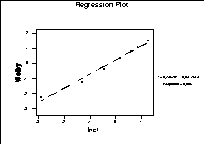
A Weibull plot looks better:

This gives Weibull fit with alpha = 0.93, beta = 0.77:
