CALCULATING BENCHMARK DOSE FOR INHALATION CONCENTRATION FOR
STYRENE NEUROTOXICITY
Epidemiological study:
50 workers exposed to styrene (average 8.6 years)
Control group:
Manual workers from same geographic region, not known to be exposed to neurotoxic agents. Matched for age, sex, educational level, intelligence. Screened for absence of metabolic, neurologic, or psychiatric disorders; limited cigarette usage; and limited ethanol intake.
Subjects asked to avoid alcohol and other drugs for at least 2 days before biomonitoring and neuropsychologic tests.
Styrene exposure measured by urinary metabolites
Eight neuropsychologic tests administered to test for effects.
Data collected by Mutti et al (1984) as reported in Rabovsky et al Risk Analysis, February 2001.
(Groups formed by range of styrene exposure and labeled by styrene level corresponding to mean level of urinary metabolites)
|
Styrene air |
numb in |
numb resp |
prop resp |
||
|
level (ppm) |
group |
abnormally |
abnormally |
||
|
50 |
4 |
0.08 |
|||
|
15 |
14 |
6 |
0.42 |
||
|
44 |
9 |
6 |
0.67 |
||
|
74 |
14 |
10 |
0.71 |
||
|
115 |
13 |
11 |
0.85 |
||
Note :
1. No NOAEL
2. The difference between the control and lowest exposure groups is statistically significant, so the LOAEL is 15pp.
Recall: A dose response curve with response as proportions represents the CDF of the random variable D = dose to cause an effect. Try Wiebull and lognormal fits:
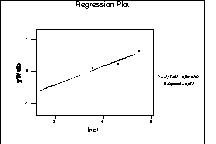
Plot ln(ln(1/(1-prop))) vs ln(dose) to check for Weibull fit:

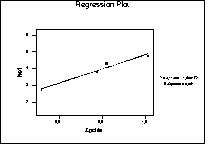
Plot log(dose) vs percentile of standard normal to check for lognormal fit:

Plots of data and fits to CDF's"
Weibull: alpha = 0.58, beta = 42.4

Lognormal: mu = 3.1, sigma = 1.7:

BMD for 5% response (i.e., the dose at which only 5% of the population would show an effect greater than background risk):
Background risk = 8% ~~>
Use inverse cdf of 13%
Weibull: 1.42 ppm
Lognormal: 3.3 ppm
(Compare with LOAEL: 15 ppm)
How to calculate BMDL's?
Normal approximation techniques for proportions won't work:
1. Different sample sizes
2. Small sample sizes
3. How to follow the curve?
Various statistical techniques requiring appropriate software can be used.