COMMON MISTEAKS MISTAKES IN USING STATISTICS: Spotting and Avoiding Them

Introduction      Types of Mistakes       Suggestions       Resources        Table of Contents        About    Glossary    Blog


Overfitting

With four parameters I can fit an elephant and with five I can make him wiggle his trunk.
John von Neumann

If we are given n distinct x values and corresponding y values for each, it is possible to find a curve going exactly through all n resulting points (x,y); this can be done by setting up a system of equations and solving simultaneously. But this is not what regression methods typically are designed to do. Most regression methods (e.g., least squares) estimate conditional means of the response variable given the explanatory variables.  They are not expected to go through all the data points.

For example, with one explanatory variable X (e.g., height) and response variable Y (e.g., weight), if we fix a value x of X, we have a conditional distribution of Y given X = x (e.g., the conditional distribution of weight for people with height x). This conditional distribution has an expected value (population mean), which we will denote E(Y|X = x) (e.g., the mean weight of people with height x). This is the conditional mean of Y given X = x. It depends on x -- in other words, E(Y|X = x) is a mathematical function of x.

In least squares regression1, one of the model assumptions is that the conditional mean function has a specified form. Then we use the data to find a function of x which approximates the function E(Y|X = x). This is different from, and subtler (and harder) than, finding a curve that goes through all the data points.

Example: To illustrate, I have used simulated data: five points sampled from a joint distribution where the conditional mean E(Y|X = x) is known to be x2, and where each conditional distribution Y|(X = x) is normal with standard deviation 1. I used least squares regression to estimate the conditional means by a quadratic curve y = a +bx + cx2. That is, I used least squares regression, with
    E(Y|X=x) = α
+βx + γx2
as one of the model assumptions2
to obtain estimates a, b, and c of α, β, and γ (respectively), based on the data.
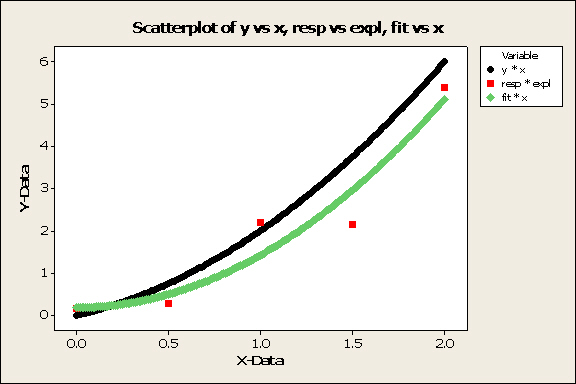
The graph below shows:
Note that the points sampled from the distribution do not lie on the curve of means (black). Notice that the green curve is not exactly the same as the black curve, but is close. In this example, the sampled points were mostly below the curve of means. Since the regression curve (green) was calculated using just the five sampled points (red), the red points are more evenly distributed above and below it (green curve) than they are in relation to the real curve of means (black).

Mean curve and five points

Note: In a real world example, we would not know the conditional mean function (black curve) -- and in most problems, would not even know in advance whether it is linear, quadratic, or something else. Thus, part of the problem of finding an appropriate regression curve is figuring out what kind of function it should be.

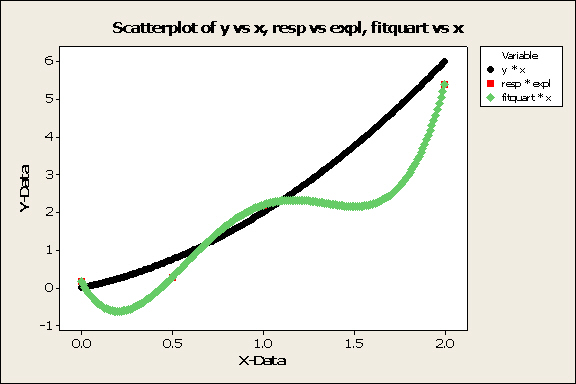
Continuing with this example, if we (naively) try to get a "good fit" by trying a quartic (fourth degree) regression curve (that is, using a model assumption of the form
E(Y|X=x) = α1x + β2x2 +  β3x3 +  β4x4 ), we get the following picture:

Five point with quadratic mean curve and quartic regression curve

You can barely see any of the red points in this picture. That is because they are all on the calculated regression curve (green). We have found a regression curve that fits all the data! But it is not a good regression curve -- because what we are really trying to estimate by regression is the black curve (curve of conditional means). We have done a rotten job of that; we have made the mistake of overfitting. We have fit an elephant, so to speak.

If we had instead tried to fit a cubic (third degree) regression curve
(that is, using a model assumption of the form E(Y|X=x) = α1x + β2x2 +  β3x3), we would get something more wiggly than the quadratic fit and less wiggly than the quartic fit. However, it would still be overfitting, since (by construction) the correct model assumption for these data would be a quadratic mean function.

How can overfitting be avoided?

As with most things in statistics, there are no hard and fast rules that guarantee success. However, here some guidelines. They apply to many other types of statistical models (e.g., multilinear, mixed models, general linear models, hierarchical models) as well as least squares regression.

1. Validate your model (for the mean function, or whatever else you are modeling) if at all possible. Good and Hardin3 (p. 188) list three general types of validation methods :

i. Independent validation (e.g., wait till the future and see if predictions are accurate)
This of course is not always possible.

ii. Split the sample. Use one part for model-building, the other for validation. (See item II(c) of Data Snooping for more discussion.)

iii. Resampling methods.

Details on these methods are beyond the scope of this website; see Chapter 13 of Good and Hardin3, and the further references provided there, for more information.

2. Gather plenty of (ideally, well-sampled) data.

If you are gathering data (especially through an experiment), be sure to consult the literature on optimal design to plan the data collection to get the tightest possible estimates from the least amount of data.4

Unfortunately, there is not much known about sample sizes needed for good modeling. Ryan5 quotes Draper and Smith6 as suggesting that the number of observations should be at least ten times the number of terms. Good and Hardin3 (p. 183) offer the following conjecture:

"If m points are required to determine a univariate regression line with sufficient precision, then it will take at least mn observations and perhaps n!mn observations to appropriately characterize and evaluate a regression model with n variables."
3. Pay particular attention to transparency (FUTURE LINK) and avoiding overinterpretation in reporting your results. For example, be sure to state carefully what assumptions you made, what decisions you made, your basis for making these decisions, and what validation procedures you used. Provide (
in supplementary online material if necessary) enough detail so that another researcher could replicate your methods.

Notes:
1. Least squares is the most common form of regression. Other types of regression may or may not have this as one of their model assumptions

2. There are other ways of expressing this model assumption, for example,
y = α +βx + γx2 + ε,
or
yi = α +βxi + γxi2 + εi
3. P. I. Good and J. W. Hardin (2006). Common Errors in Statistics (And How to Avoid Them), Wiley.
4. For regression, the values of the explanatory variable (x values, in the above example) do not usually need to be randomly sampled; choosing them carefully can minimize variances and thus give tighter estimates.
5. T. Ryan (2009), Modern Regression Methods, Wiley, p. 20
6. N. Draper and H. Smith (1998), Applied Regression Analysis, Wiley

Last updated June 13, 2014