COMMON MISTEAKS
MISTAKES IN
USING STATISTICS: Spotting and Avoiding Them
Overinterpreting High R2
1. Just what is considered high R2 varies from
field to field. In many areas of the social and biological sciences, an
R2 of about 0.50 or 0.60 is considered high. Yet Cook and
Weisberg1 give an example of a simulated data set with 50
predictors and 100 observations, where the response was independent of
all the predictors (so all regressors have coefficient zero in the true
mean function), but R2 =
0.59.2
2. High R2
can also occur when overfitting. The R2
for the example of overfitting by a quartic
curve was 1.00, since the curve went through all the points.
3. A regression model giving apparently high R2
may not be as good a fit as might be obtained by
a
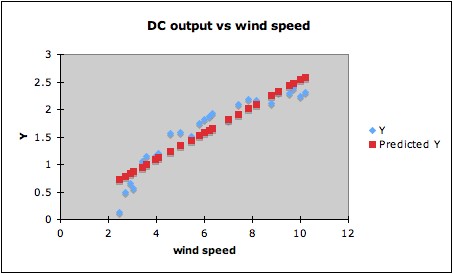
transformation. For example, fitting a linear regression to the
following data (DC output of a windmill vs windspeed) will give R2
= 0.87. (Data in blue, regression line in red.)
This for some purposes might be a good enough fit. However,
since the data indicate a clear curved trend, it is likely that a
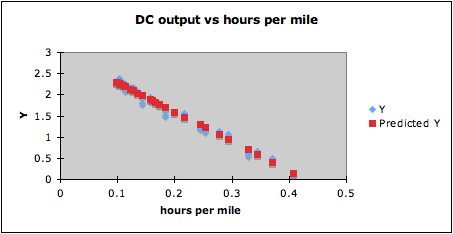
better fit can be found by a suitable transformation. Since the
predictor windspeed is a rate (miles per hour), one possibility is that
the reciprocal (hours per mile) might be a natural choice of
transformation. Trying this gives R2
= 0.98, and the plot below shows that indeed a linear
fit for the transformed data makes more sense than for the
untransformed data.
Notes:
1. R.D. Cook and S. Weisberg (1999), Applied Regression Including Computing and
Graphics, Wiley, p. 281.
2. The p-value of the F-statistic for significance of the overall
regression was 0.13, however. But six of the terms were individually
significant at the .05 level.
Last updated June 13, 2014