This
site is under construction. Please check back every few weeks for
updates
COMMON MISTEAKS
MISTAKES IN
USING STATISTICS: Spotting and Avoiding Them
Interpreting
a Coefficient as a Rate of Change in Y Instead of as a Rate of Change
in the Conditional Mean of Y.
As pointed out in the discussion of
overfitting, the computed
regression equation estimates the true conditional
mean function. How
well it estimates the behavior of actual values of the random variable
depends on the variability of the response variable Y. Thus,
interpreting the computed
coefficients in terms of the response
variable is often misleading.
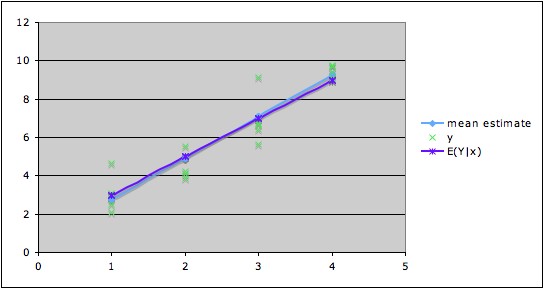
Illustration:
In the graph
shown below, the data are marked in green, the true line of conditional
means is in violet, and the fitted (computed)
regression line is in blue. Note that the fitted regression line is
close to the true line of conditional means. The equation of the fitted
regression line is (with coefficients rounded to a reasonable degree) ŷ
= 0.56 + 2.18x.1 Thus it is
accurate to say, "For each change of one unit in x, the average
change in the mean of Y is about 2.18 units." It is not accurate
to say, "For each change of one unit in x, Y changes about 2.18 units."
For example, we can see from the graph that when x is 2, Y might be
anywhere between a little below 4
to a little above 5.5; when x is 3, Y might be anywhere from a little
more than 5.5 to a little more than 9. So when going from x = 2 to x =
3, the change in Y might be almost zero, or it might be as large as 5.5
units.
Notes:
1. The true line of means in this constructed
example is E(Y|X = x) = 1 + 2x.